Social Network Analysis
Social network analysis studies social structures by representing them as graphs: people or organizations are nodes and their relationships are edges. We explain its centrality metrics, concepts such as communities and small-world, its historical roots and its current connection to AI through graph neural networks.

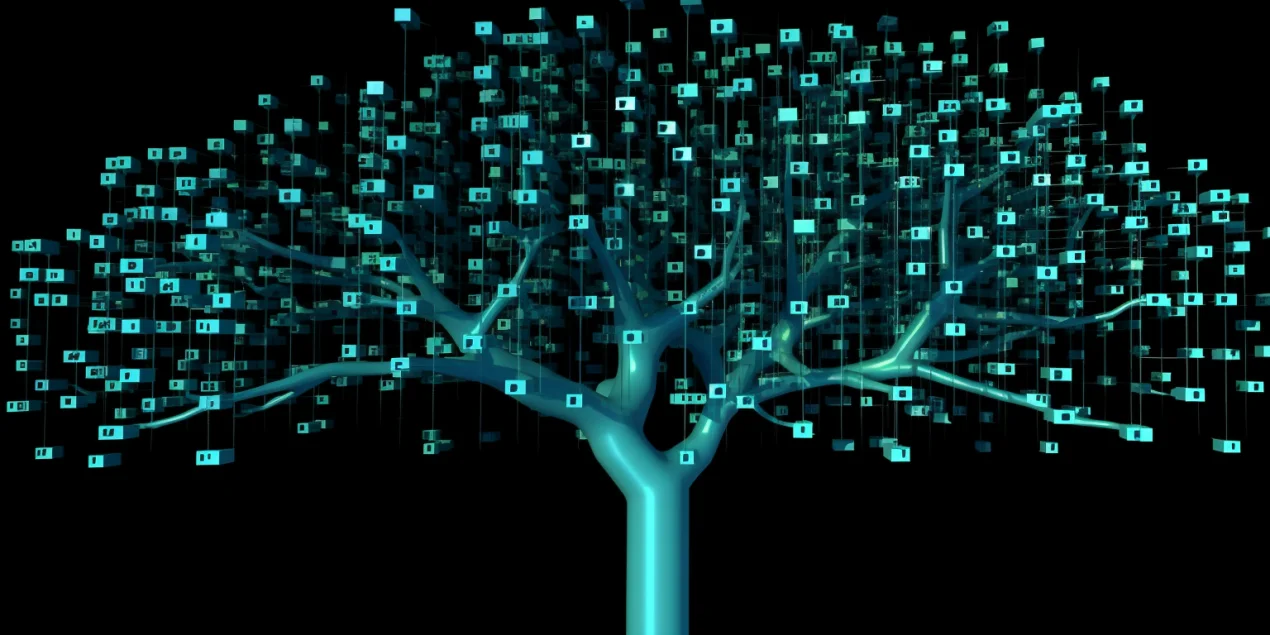
Social network analysis (SNA) is the study of the structure of social relationships through graph theory: it represents entities—such as people and organizations—as nodes, and the relationships between them—such as friendship, collaboration and communication—as edges. A caveat is in order: this is the structural analysis of networks, not the management of profiles on social platforms. Its central aim is to understand how each individual actor's position in the network shapes the flow of information and influence.
Centrality metrics
The heart of SNA are the measures of centrality, which quantify a node's importance. Degree counts how many connections it has. Betweenness measures how often a node acts as a bridge on the shortest paths between two others—that is, its role as a bottleneck of flow. Closeness reflects how quickly a node can reach the rest. And eigenvector centrality scores a node according to the importance of its neighbors: it counts not just how many connections it has, but their quality. The famous PageRank is a relative of this last one.
Communities, bridges and small-world
On that basis, structural phenomena are studied. Community detection looks for densely connected groups within the network. Homophily describes the tendency to relate to those who resemble us. Weak ties and structural holes—concepts linked to Mark Granovetter and Ronald Burt—explain why bridges between groups bring new information. And the small-world effect, formalized by Duncan Watts and Steven Strogatz in 1998, captures that in many real networks any two nodes are separated by surprisingly short chains.
Where it comes from
Its roots lie in Jacob Moreno's sociometry, which introduced the sociogram in the 1930s—the diagram of dots and lines used to represent relationships among people—and in the graph theory that supplies the mathematical machinery. John A. Barnes used “social network” in his 1954 study of a Norwegian community. More quantitative methods and studies of diffusion, organizations, and job seeking followed; that trajectory is more precise than giving the field a single birth date.
Its connection to AI
Today SNA intersects with artificial intelligence. Graph neural networks process representations of nodes, edges, and global attributes while respecting relational structure, rather than treating every row as an isolated example. One documented case is the use of R-GCNs for link prediction and entity classification. The architecture contributes a relational inductive bias, not an automatic answer: recommendation, diffusion, or epidemiology still require decisions about what nodes and edges mean, which labels exist, and how the prediction will be validated.
This article was produced with artificial intelligence under human editorial oversight.