Variance
Variance measures how far values spread around their mean —the expected value of the squared deviation— and, in machine learning, it also names a model's sensitivity to its training data.
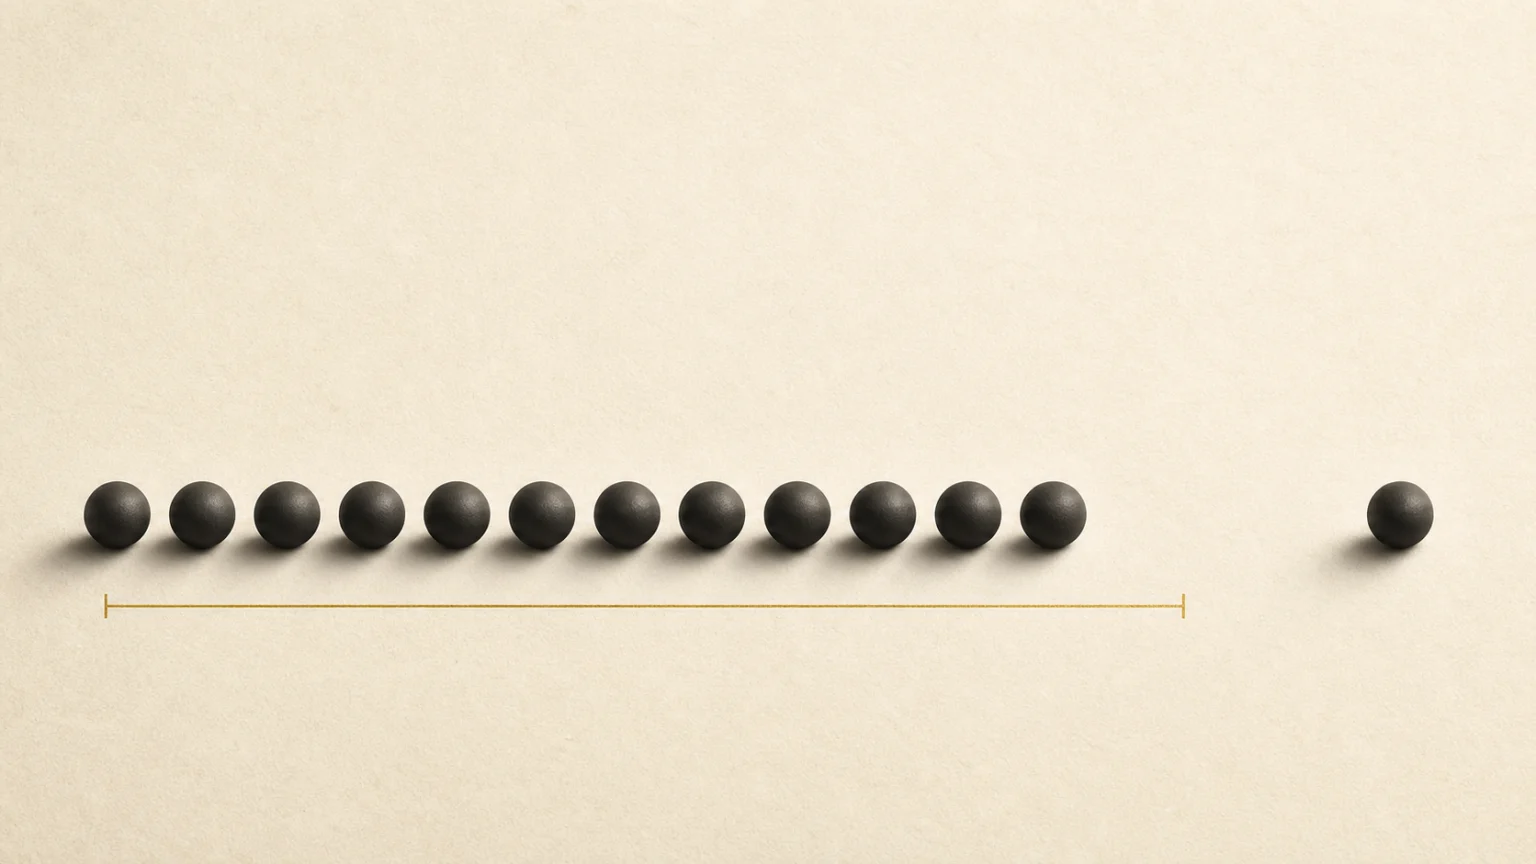
In statistics, variance is a measure of dispersion: it quantifies how far the values of a variable spread out around their mean. Formally, it is the expected value of the squared deviation from the mean, written Var(X) = E[(X − μ)²], where μ is the mean (or expectation) of the variable. A small variance means the data cluster close to the mean; a large variance means they are widely scattered.
Squaring the deviations makes variance weigh large departures more heavily and stops positive and negative deviations from cancelling out. A convenient identity for computing it is Var(X) = E[X²] − (E[X])². Because of that squaring, variance is expressed in the squared units of the variable: if we measure heights in centimetres, the variance comes out in square centimetres, which makes it hard to interpret directly.
Population and sample variance
It is worth distinguishing two versions. The population variance, denoted σ², averages the squared deviations over all N members of the population: you sum the terms (xᵢ − μ)² and divide by N. The sample variance, denoted s², is used when we only have a sample and want to estimate the variance of the population. Here a subtlety appears: you divide by n − 1 rather than n. This is Bessel's correction, named after the astronomer Friedrich Bessel. The reason is that using the sample mean in place of the true (unknown) mean makes the deviations fall slightly short and underestimate the spread; dividing by n − 1 corrects this downward bias and makes s² an unbiased estimator of σ².
Relationship with the standard deviation
Variance is closely tied to the standard deviation, which is simply its square root: σ = √(σ²). Taking the root solves the units problem. Whereas variance lives in squared units, the standard deviation returns to the original units of the variable, so it is usually preferred for describing and interpreting spread. Both rank data sets the same way: if one distribution has more variance than another, it also has a larger standard deviation.
Variance in the bias-variance tradeoff
In machine learning, variance takes on a second meaning that should not be confused with statistical dispersion. Here it denotes a model's sensitivity to the particular data it is trained on: a high-variance model changes its predictions sharply when trained on different samples, a sign of overfitting—it learns noise rather than the pattern. In regression with mean squared error, the expected error can be decomposed into squared bias, variance and irreducible noise; lowering one may raise the other, a tension known as the bias-variance tradeoff. Techniques such as cross-validation, regularization and model ensembles are used to manage that tradeoff, but the identity does not prove that any one technique will reduce variance on every dataset.
Pieces using this term
- Graph Engineering: The Signal, the Spend, and What We Don't Know (2026-08-04)
- J-Lens: How to Look Inside Claude Without Mistaking a Probe for Its Mind (2026-07-18)
- GPT-5.6 without confusion: model, product, effort and price are separate layers (2026-07-13)
- Apple explores how to keep AI from losing the thread when editing images (2026-05-11)
- Gemini 3 Flash brings the speed, price, and quality tradeoff to the default product (2025-12-17)
- Preprocessing Without Leaking the Future: Fit and Transform (2023-05-09)
- Cross-Validation: How to Select a Model Without Training on the Exam (2023-05-09)
- Machine Learning from Scratch: Seven Decisions Behind a Model (2023-05-09)
This article was produced with artificial intelligence under human editorial oversight.