How to read a PyTorch attention trace before optimizing it
The profiler reveals kernels, copies and SDPA paths hidden by source code. Careful analysis separates warm-up, CPU, GPU, memory and correctness before changing backends.
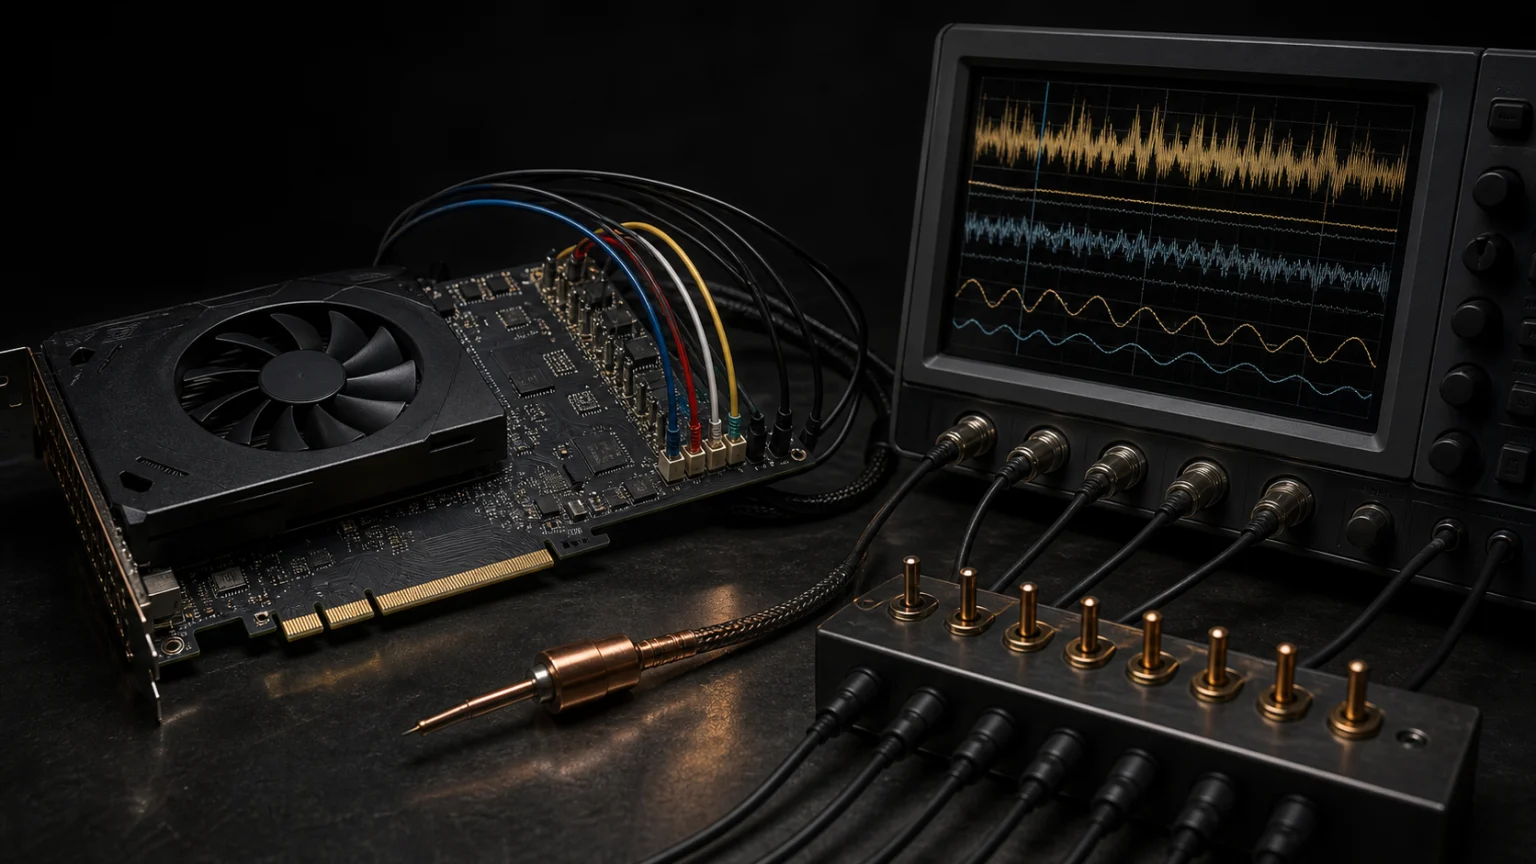
On July 10, 2026, Hugging Face published part three of a PyTorch profiling series, this time focused on attention. The example begins with readable code, opens its trace and uncovers copies, kernels and CPU work that Python does not expose. The lesson is not that one backend always wins, but that an optimization exists only relative to measured shape, dtype, device and workload.
Reading a trace means translating layers. A high-level call may dispatch ATen operators; they invoke runtime functions; the GPU executes kernels and moves data. A short Python bar can contain substantial work, while a visually clean trace may have shifted work into an opaque library. The transferable skill is predicting what should appear first and treating every mismatch with the trace as evidence rather than noise.
Before measuring: define the experiment
The torch.profiler documentation supports CPU and CUDA activities, input shapes, stacks and memory. Those options are not free. PyTorch warns that shape and stack tracing add overhead; record_shapes=True temporarily retains tensor references, potentially blocking reference-count optimizations and introducing additional copies. An instrumented trace describes an observed run, not a completely invisible camera.
The test case should pin PyTorch version, GPU, driver, dtype, batch size, heads, sequence length, head dimension, masking, training or inference, and use of torch.compile. It then needs warm-up. The first run may include lazy initialization, algorithm selection or compilation. PyTorch provides a schedule with wait, warm-up and recording phases so startup is not mixed with steady state.
It also helps to label regions with record_function and synchronize when calculating latency outside the profiler. CUDA operations are asynchronous relative to the CPU: launching work is not completing it. The aggregate table locates candidates; the timeline shows dependencies, gaps, overlap and copies. Neither view replaces the other.
From five steps to six kernels
Direct causal attention calculates q @ k.T, scales scores, applies a mask, normalizes with softmax and multiplies by v. On the 80 GB A100-SXM4 used in the tutorial, that sequence produced six kernels: the five expected operations plus a copy associated with masked_fill. Replacing it with masked_fill_ removed the copy and left five kernels.
The correct conclusion includes a condition. The experiment ran inference under torch.no_grad. During training, autograd may need earlier values for gradients; an in-place operation overwrites them and can break backward. The underscore is not a universal speed switch. Adoption requires forward and backward tests, output and gradient comparisons, and peak-memory measurement on the real case.
The finding teaches how to read a mismatch. Pseudocode predicted five operations and the trace showed six; the extra copy justified investigating which operator returned a new tensor. Kernel counts alone do not rank performance — one kernel may do far more work than another — but they help locate unexpected launches and materializations repeated in every layer.
SDPA is a selector, not one algorithm
torch.nn.functional.scaled_dot_product_attention, or SDPA, hides the same sequence behind one call. The official SDPA reference lists math, FlashAttention-2 and memory-efficient implementations. On CUDA it attempts to select a compatible implementation automatically; torch.nn.attention.sdpa_kernel can restrict backends for comparison. If a fused path cannot handle a combination, PyTorch may explain why in a warning.
Selection depends on hardware, dtype, dimensions, mask and experimental features. Forcing Flash and receiving a warning does not show that PyTorch is broken; it records an incompatibility. The useful next step is preserving the message and changing one variable at a time. When precision, shape and mask all change together, improvement cannot be assigned to one cause.
In Hugging Face's experiment, the math backend launched 20 kernels per forward and took about 3.7 times as long as the naive in-place version. The trace showed concrete reasons: causal-mask materialization, protected softmax and FP32 operations rather than the Tensor Core bfloat16 path. That general implementation protects cases omitted by the manual example. Being slower on one shape does not make it erroneous; it makes it a useful baseline for correctness and compatibility.
Fusion reduces traffic; it is not magic
The efficient, Flash and cuDNN paths in the tested environment appeared as one fused kernel per forward. FlashAttention reorganizes the calculation into blocks to reduce reads and writes between high-capacity memory and fast on-chip memory, avoiding materialization of the full attention matrix in main memory. The result remains exact attention within numerical differences caused by operation order; the gain comes from data-movement awareness, not arbitrary omission of work.
For the shape measured on the A100, the tutorial reported 146.8 GPU microseconds for Flash, 186.3 for cuDNN and 277.9 for efficient. Those are not constants attached to names. Sequence length, head dimension, batch, architecture or dtype may reorder them. cuDNN, for example, spent more CPU time selecting and preparing its plan. One GPU bar concealed work that remained visible on the CPU lane.
Occupancy is not a grade either. The Flash kernel showed estimated occupancy near 13% because each block used substantial registers and shared memory to retain data on chip. That use can limit simultaneous resident blocks while still cutting global traffic sharply. Optimizing a secondary metric such as occupancy without time and byte movement can worsen the real objective.
Correctness before celebrating microseconds
SDPA applies dropout according to dropout_p even when a module is in evaluation mode; disabling it requires explicitly passing 0.0. Boolean-mask semantics also differ from MultiheadAttention: in SDPA, True participates; in key_padding_mask, True is masked. A migration that forgets inversion can be extremely fast while producing the wrong answer.
Fused backends may produce numerically different results because of operation order and precision. The math path supports float64 and keeps intermediates in float when inputs are half or bfloat16. Comparisons should pin appropriate tolerances and exercise edge cases: fully masked rows, short and long sequences, causal and explicit masks, forward and backward. Comparing only a mean output can conceal localized failure.
With torch.compile, first invocation and steady state need separation. The compiler profiling guide recommends including the first call when investigating compilation and running a separate warm-up for lazy initialization. For service latency, compilation is a startup cost and later calls are the recurring cost.
A reproducible reading in six questions
Before code changes, a trace should answer: which region was measured, was it warmed up, which kernel dominates GPU self time, which parent operator dominates total time, do copies or gaps appear, and what work moved to CPU? Then form one small hypothesis: remove a materialization, change backend or reuse a mask. Change one thing and repeat the same protocol.
A minimum report retains script, seed, versions, shapes, dtype, device, backend configuration, repetitions, median and percentiles. It includes latency, memory and an equivalence test. It also keeps the incompatibility warning when a route fails. “Flash was faster” then becomes a testable statement: it was faster for these inputs and conditions, within this tolerance.
The profiler does not automatically recommend an optimization. It does something more valuable: it exposes the distance between the imagined program and the executed one. Learning to find that distance — an unexpected copy, rebuilt mask, hidden CPU cost or different backend — enables attention improvements without turning one number into a universal recipe or sacrificing correctness for a prettier trace.
Sources for this piece
This piece draws on 4 primary source(s), gathered during reporting.
This article was produced with artificial intelligence under human editorial oversight.