An AI bubble? How to test Swisscanto’s thesis
Gerhard Wagner says it is too early to call AI a bubble. His thesis offers a way to separate utility, investment, profits and valuation instead of conflating them.

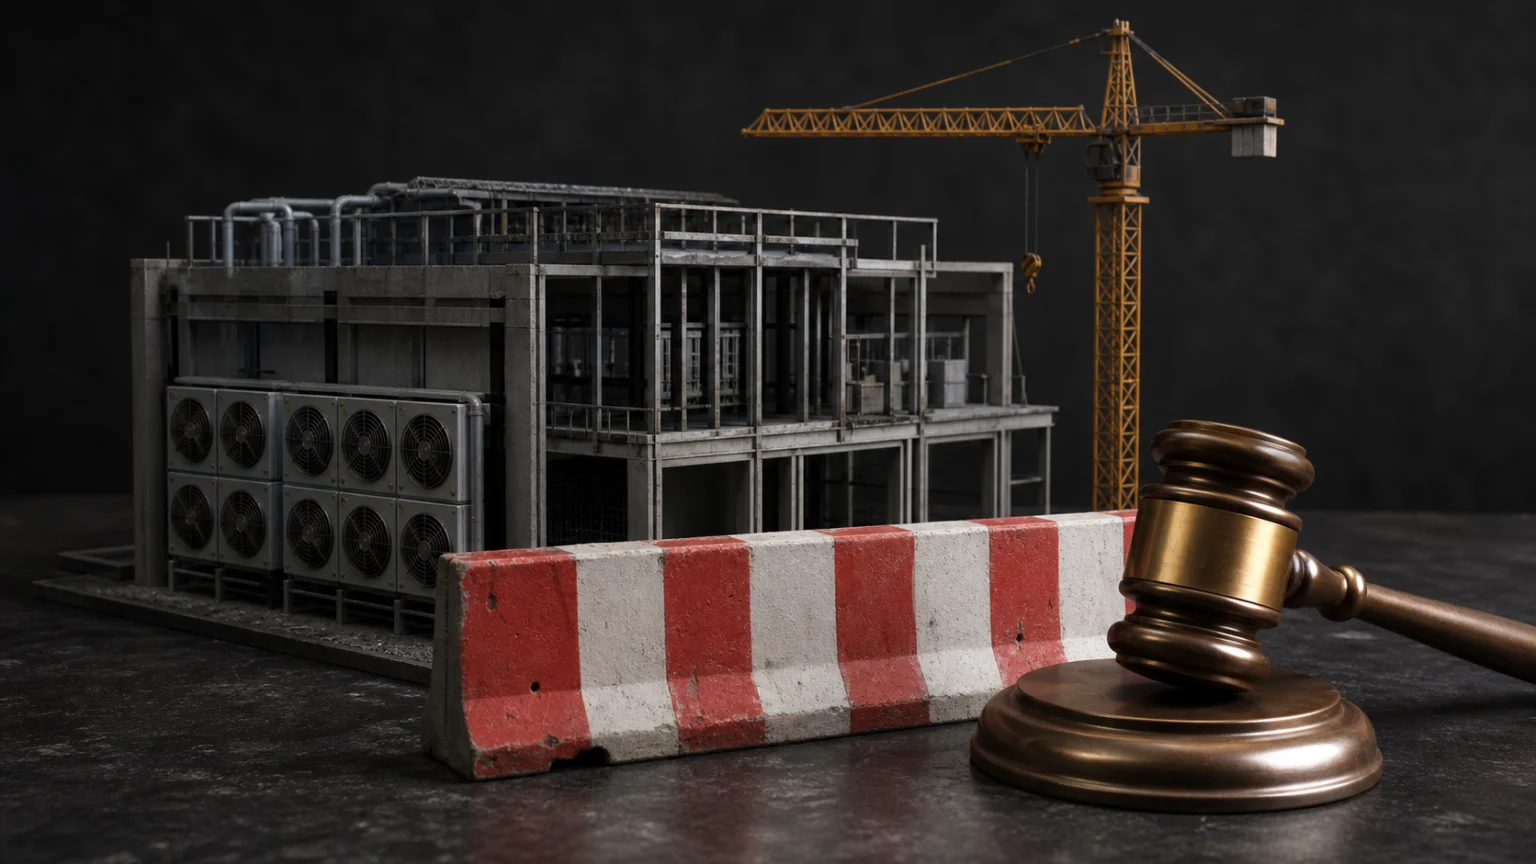
A technology can reshape the economy and still produce disastrous investments. A company can multiply its earnings and remain too expensive. Both possibilities tend to disappear when the debate is compressed into one word: bubble. On 3 March 2026, Gerhard Wagner, Head of Sustainable Equities Strategies at Zürcher Kantonalbank, said in an interview published by Finect that it was too early to apply that label to artificial intelligence, while acknowledging that some areas could be overvalued.
The useful response is not to accept or reject his optimism. It is to split the claim into independent tests: whether real demand exists, whether installed capacity is used, whether revenue turns into cash after paying for infrastructure, and whether each share price assumes a plausible future. That method will remain useful after the models, chips and company names have changed.
First identify who is making the case
Wagner is not speaking from a neutral institution. He is a portfolio manager, and Swisscanto presents AI as one of the central themes in its global equity strategy. The asset manager’s own analysis, published on 23 February, says the portfolio was overweight information technology, industrials and healthcare. Its legal disclaimer adds two material limits: the document serves advertising and information purposes, and the opinions are not presented as independent financial research.
That does not invalidate the thesis. It changes how it should be read. A source can understand a sector deeply and still have an economic interest in its interpretation. The right question is not whether it deserves absolute trust, but which parts of its argument can be checked outside its portfolio. There are three separate claims here: AI has durable applications; infrastructure investment can earn a return; and particular shares do not embed excessive expectations. None automatically proves the others.
Technology and valuation require different tests
A technological bubble and a stock-market bubble are not synonyms. The internet survived companies that did not. Railways transformed regions even though many investors lost money on badly financed lines. The social utility of infrastructure does not determine how much profit each supplier will capture or how much investors should pay today for future earnings.
Nor is it enough to observe that a multiple such as price-to-earnings has not risen. If earnings grow, the share price can rise at the same rate and the multiple can remain unchanged; the price still assumes that those earnings will not collapse. Wagner uses Nvidia to argue that its price, sales and profits have moved broadly together. The careful inference is narrower: the share-price increase was not solely multiple expansion. It does not prove that future demand, margins or competition will match market expectations.
A multiple is also a snapshot containing accounting choices. The US Securities and Exchange Commission’s guide to reading a 10-K directs readers to the income statement, balance sheet, cash-flow statement and accompanying notes, and to management’s discussion of risks, obligations and critical estimates. It also warns that non-GAAP measures require the reader to decide how much weight to give them. Looking only at adjusted earnings or only at free cash flow can hide a different part of the cost.
Bridge one: investment to operating capacity
The volume of capital is real. The International Energy Agency estimated in April 2026 that capital expenditure by five large technology companies exceeded $400 billion in 2025 and could rise by another 75% in 2026. Yet the same report warns that not every announced project will materialise, that bottlenecks affect grids, electricity, advanced memory and chip production, and that data-centre expansion will be sensitive to financing conditions and expected returns.
The first check is therefore physical: how much spending becomes installed equipment and connected facilities, and how much remains in construction, prepayments or delayed projects. Capex is not the same as available capacity. Its components do not age at the same rate either. Land, a substation, a building and a GPU have different economic lives; combining them in one figure conceals obsolescence risk.
Operating capacity also needs power and a grid connection. The IEA projected global data-centre electricity consumption rising from 485 TWh in 2025 to roughly 950 TWh in 2030, but presented that number as a central scenario, not a contract. Efficiency is improving, intensive uses are growing and grid delays constrain the most aggressive near-term cases. A forecast with sensitivities is more informative than an isolated number because it shows what would have to change for the outcome to be lower or higher.
Bridge two: capacity to usage someone pays for
A powered server does not necessarily earn an adequate return. Look for utilisation, contracts, recognised revenue and customer renewals. It is also important to separate external demand from capacity that a provider consumes internally to train models or improve existing products. Both may create value, but they leave different financial evidence.
Company results help, although they retain management’s point of view. In its fiscal 2026 third-quarter earnings call, Microsoft said it expected quarterly capex above $40 billion and about $190 billion for calendar 2026. It also confronted the decisive investor question: how that spending becomes revenue-ready capacity and who ultimately pays for the usage. The company pointed to demand exceeding supply and Azure growth, but forward guidance remains a management claim, not an accomplished result.
The test must be repeated over several quarters: capacity entering service, growth attributable to AI services, contracted obligations turning into sales, and usage or renewal rates. If spending rises without matching utilisation, incremental revenue or willingness to pay, the bridge weakens. If they advance together, the thesis gains support without becoming a guarantee about the share price.
Bridge three: revenue to economic profit
Revenue alone does not pay the cost of capital. Readers should compare gross margin, operating cash flow, purchases of property and equipment, finance leases, depreciation and energy costs. Timing matters: buying a server consumes cash now, while its accounting cost may be spread over several years. Extending its estimated useful life lowers annual depreciation and raises reported profit even though it does not change the cash already spent.
Alphabet provided a concrete example in its 2025 results. It reported $91.4 billion of annual capex, with about 60% allocated to servers and 40% to data centres and networking equipment. It also said depreciation had risen 38% to $21.1 billion and expected more pressure in 2026. Those figures do not decide whether the investment is good; they define the test: will future growth and margins compensate for equipment, buildings, power and replacement costs?
It also matters who captures the value. A shortage may temporarily favour a chipmaker, but competition, customers’ in-house designs, efficiency improvements or a bottleneck shifting to electricity can redistribute returns. Growth across the whole chain does not mean that every link will preserve its margin.
Bridge four: profit to the price paid
Only then does valuation enter. A share discounts a sequence of future profits, not the latest quarter. The useful exercise reverses the question: rather than deciding whether a multiple “looks high,” estimate what revenue growth, margin and reinvestment would have to persist to justify the price. Then compare that path with contract duration, competitive intensity, hardware life and the cost of financing new capacity.
Three scenarios avoid false precision. In the central case, utilisation and margins develop as the company expects. In the downside case, adoption takes longer, inference prices fall or assets require earlier replacement. In the upside case, demand grows and efficiencies raise the return on capital. This need not become investment advice: identify which assumption drives the result and which future observation could falsify it.
A testable answer instead of a label
Swisscanto is right about an essential distinction: structural potential and specific overvaluation can coexist. Its thesis becomes stronger when it leaves the all-or-nothing label behind and passes through four observable bridges: investment converted into capacity, capacity converted into paid usage, revenue converted into cash after all costs, and profits compared with the current price.
The honest conclusion as of 25 July 2026 was neither “there is a bubble” nor “there is no bubble.” There was extraordinary physical expansion, stated demand and profits in parts of the chain, alongside forecasts, bottlenecks and returns still to be demonstrated. The transferable skill is to read every new AI proclamation as a chain of conversions: when a bridge is missing, technological excitement has not yet become economic evidence.
Sources for this piece
This piece draws on 3 primary source(s), gathered during reporting.
This article was produced with artificial intelligence under human editorial oversight.